The Numbers
Quants 'R Us
For all you Quants out there .... and me
The Numbers:
- Total Days 64
- Bike Days. 50
- Non Bike Days. 14
- Total Distance 2,731 km
- Total Ascent 35,462 m
- Avg Bike Day 54 km
- Avg Pedal time /day 3.5 hrs
- Avg Speed 15.1 km/hr
- Avg Daily Ascent. 709 m
- Avg Climb Intensity 13.0 m/km
- Max Day Distance 94 km - Sirmione to so very quirky Quistello
- Min Day Distance 14 km - Madulain to Surfers - Train and Bus
- Max Day Ascent 1707 m - Sella Ronda
Sustenance:
- Michelin recommended Restaurants 21
- With Michelin Bibs 4
- With Michelin Stars 3
- Total Stars. 7
- Restaurants that should be Michelin recommended 3
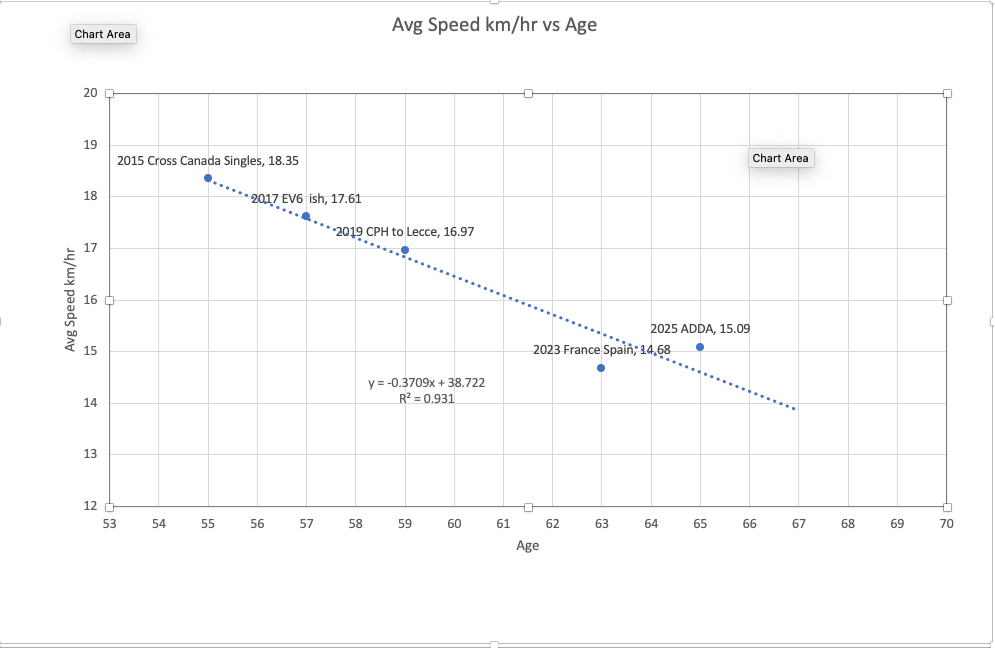
Once again, this tour was the shortest distance wise of the five multi-month tours we've done (just a little bit shy of our 2023 Gorges and Pyrenees tour), with the lowest average moving time (continually degrading willpower ???). However, our average speed ticked up slightly to just over 15 km/hr! Blistering pace!
Statistically, this increase in average speed is more or less meaningless when compared to the trend vs our age, - and the trend is unmistakable - we are still on the glide path to 0 km/hr sometime around the time we reach 104.
| Heart | 0 | Comment | 0 | Link |
However, the trend of our average speed vs the climb intensity (i.e how hilly the routes we choose are total accent in metres divided by total distance in kilometres) suggests that our decrease in average speed may be due to the hilliness of the terrain we are riding, and not our age. Looking at this data, we may in fact be able to keep moving indefinitely if we choose different terrain ... thinking river valley's ... pedalling downstream ... in our future. Correlation is not Causation though!

However, the unmistakable trend of how much time we are willing to pedal each day... not able to pedal ... suggests that sometime in our early 80's we're going to look over at our bikes, shrug our shoulders, and just continue sitting on the porch watching the world go by.

Well, I guess that means we've got maybe another 15 years of touring in front of us so …. stay tuned for the next Tour sometime in 2027!
| Rate this entry's writing | Heart | 3 |
| Comment on this entry | Comment | 2 |
2 days ago
2 days ago